One of the most untapped valuable resources you have on your website is your analytics. The data collected through analytics can be eye-opening in how your website is performing and guide you to how you can make it even better.
That’s why Google Analytics is something I install and setup on every single one of my custom websites and is something I highly recommend you add to your own website if you haven’t already.
FYI, in case you didn’t know, Google Analytics is free and it takes just a couple of minutes to set it up. All you need is a Gmail account or Google-hosted email account and access to your website editor and you can set up your analytics in no time flat. Install it now, seriously.
The Must-Know Google Analytic Metric
Google Analytics can provide you with a ton of juicy insights, like where your traffic is coming from and how well your website is actually performing, but getting the most out of your analytics means you have to know where to look.
No one likes being bogged down by vanity metrics that really don’t matter either which is why I want to talk about the one metric that matters most when it comes to your website.
Related Post: The Bullet-proof Website Strategy: Convert Your Visitors into Customers
Conversion Rate: The True Measure of Website Success
Your Conversion Rate… It’s the ultimate scorecard for how good your website is at turning visitors into happy customers or paying clients.
A conversion is any user action that’s valuable to your business; for example, a user purchasing from your store or subscribing to your newsletter. When you want to measure a conversion, you mark an event that measures the user action as a conversion.
Google Analytics
So now you know what a conversion is, but how is conversion rate calculated?
A conversion rate is calculated simply by taking the number of people who perform a certain action on your site (or page) divided by the total number of visitors you have. Then multiply that number by 100 to get a percentage. Keep in mind, if you’re using Google Analytics, it does all the math for you 😉
(Visitors Who Do Something / Total Visitors ) x 100 = Conversion Rate %
- If your conversion rate is high, it means your website is doing a great job at turning your visitors into customers. Keep being awesome.
- But if it’s low, it means you’ve got some work to do.
But what does high and low mean when it comes to conversion rates?
Here’s my quick take on this based on my experience and some leading industry references from Shopify and Hubspot. Although, conversion rates vary by industry and several other factors such as pricing, where your traffic is coming from, and how “warm your traffic is”, here are some general guidelines you can use.
- High Conversion Rate: 5-10%+ : This typically would be considered an awesome conversion rate in most industries.
- Average Conversion Rate: 2-5% : This is an average conversion rate benchmark for most industries.
- Low Conversion Rate: <1-2% : Anything below 1-2% conversion rate on your website would be worth investigating and optimizing further.
Keep in mind conversion rate is almost always relative at the end of the day, you should be working to improve your conversion rate based on your own historical benchmarks vs that of a competitor.

Related Post: How to Create a Bounce-Proof Homepage Design
Conversion Rate Calculation Examples
Let’s talk through some examples to illustrate the concept of conversion rates a little further.
Example: Let’s say you’re a life coach. Out of 100 visitors to your website, 5 people sign up for a free discovery call. Your conversion rate is 5%. If this is you, you deserve a pat on the back because it shows that a good chunk of your visitors are interested in your coaching services. Well done!
(5 Calls / 100 Visits) x 100 = 5% Conversion
Here’s another example: If you sell online courses, and out of 10,000 visitors to your landing page for your course, only 5 people purchase a course. That means the conversion rate is only .05%. In this case, your landing page likely needs some serious adjustments to encourage more people to enroll. Eek!
(5 Customers / 10,000 Visits) x 100 = .05% Conversion
One important thing to know about conversions is that it’s more than likely you’re going to need to take some additional steps to setup reports on your Analytics account to track events and conversions in a way that is meaningful for your business.
Basic events like page views, video views and purchases on your site are already logged by default, but you can create a custom event that gives you more valuable insight such as when certain high-value pages on your site are viewed.
How to setup custom events and conversions in Google Analytics
Step 1: Sign in to Google Analytics Log in to your Google Analytics account using your Google credentials and click on the “Admin” tab. It’s usually located in the bottom left corner.
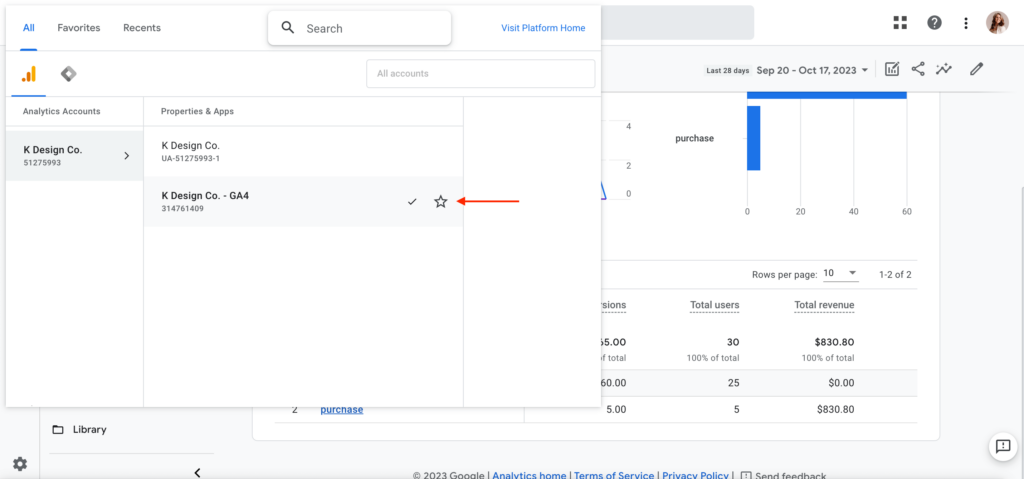
Step 2: Choose the Right Property In the “Admin” section, you’ll see two columns: Account and Property. Pro tip: Make sure you’re working with the correct website property. Select the property where you want to set up the goal.
Step 3: View your “Conversions” Under the “Property” column, you’ll find a section labeled “Conversions” Click on it. (This used to be called Goals in the old Universal Google Analytics but has changed as of June 2023.)
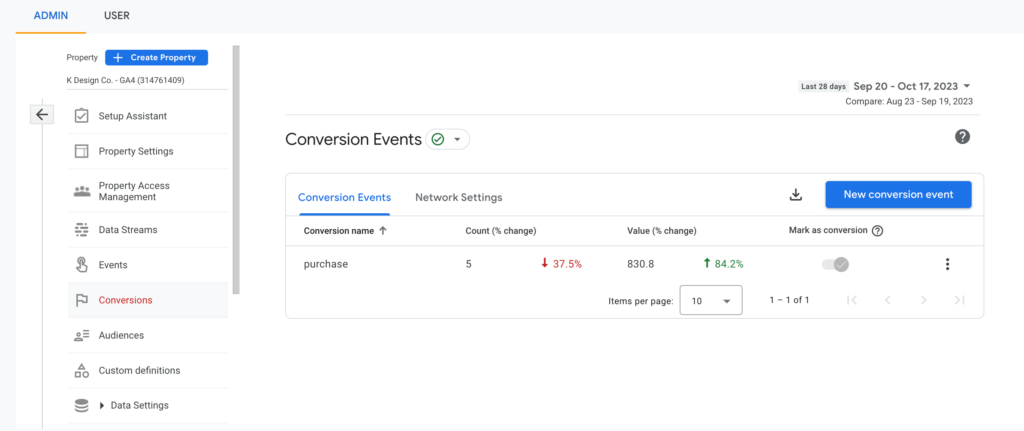
By default, you will see a list of pre-defined conversions for your website, such as purchases, that will be automatically marked as a conversion, but you can add other events that you define to your conversion list.
Events let you measure user interactions on your website or app; for example, you can measure when someone loads a specific page, clicks a link, or makes a purchase.
Google Analytics
Step 5: Create a new conversion based on a custom event. On the “Events” tab, you’ll see a button that says “+ New Event.” Click on it to start the event creation process.

You can choose from the list of pre-selected event names or create your own custom name.
- Name your event something logical and specific that will help your remember what it refers to.
- Make sure your event name doesn’t contain any spaces or special characters besides an underscore ie. newsletter_signup OR ebook_download
- Your event name must be fewer than 40 characters
Step 6: Set up your parameters and conditions for your event. Once you’ve given your event a name, choose from the the pre-defined parameter names to begin creating your custom event.
Don’t be scared by the terminology here. Think of parameters like special rules that your telling your website to look for when a certain action is taken on your site.
It’s important to note, each parameter needs to have a 1) name and a 2) value.
Here is an example of a common parameter name and value pair you might want to use if your goal is to create a conversion event for visitors who reach a specific page, like a “Thank You” page after a purchase or opt-in.
- Set the initial event parameter name: event_name (EQUALS) value: page_view
- Add another condition for the parameter name: page_location (CONTAINS or EQUALS TO) value: your-url-slug
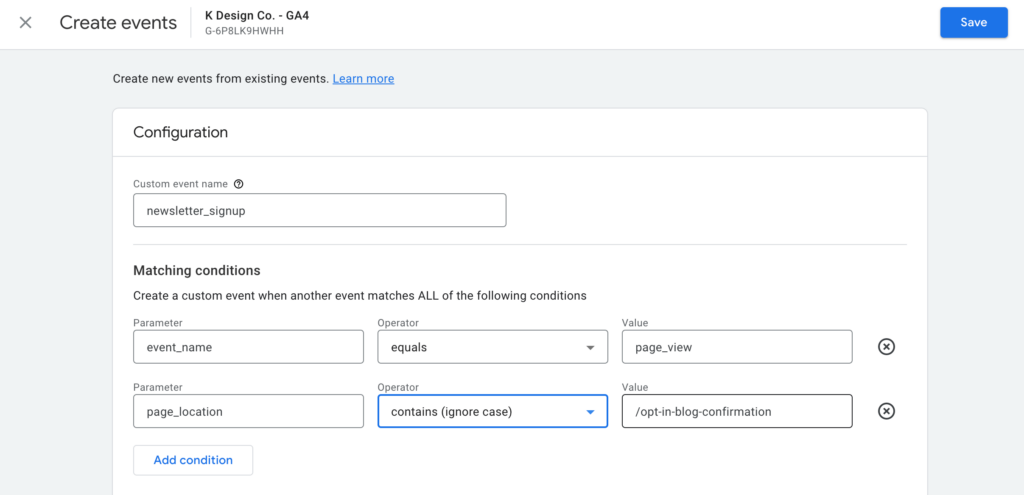
You can experiment with different parameters / values / and additional conditions until you’ve got the perfect recipe to track your desired event.
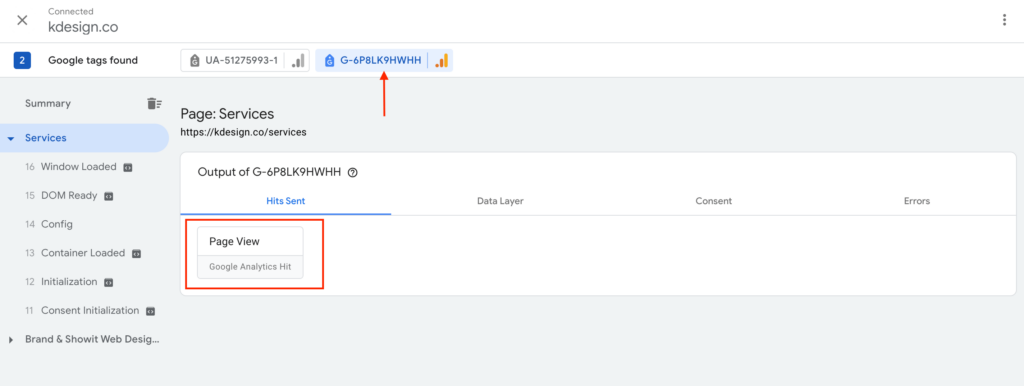
Step 8: Save & Test Review your goal details to make sure everything is accurate. Then click “Save” to create your goal. To make sure your goal is tracking correctly, you can use the Google Tag Assistant Tool to check if your custom events are being tracked and recorded.
- First add your domain to the Google Tag Assistant.

- Then connect your domain to the Tag Assistant tool. (Make sure once you are connected, you select the right analytics property if you have more than one.)
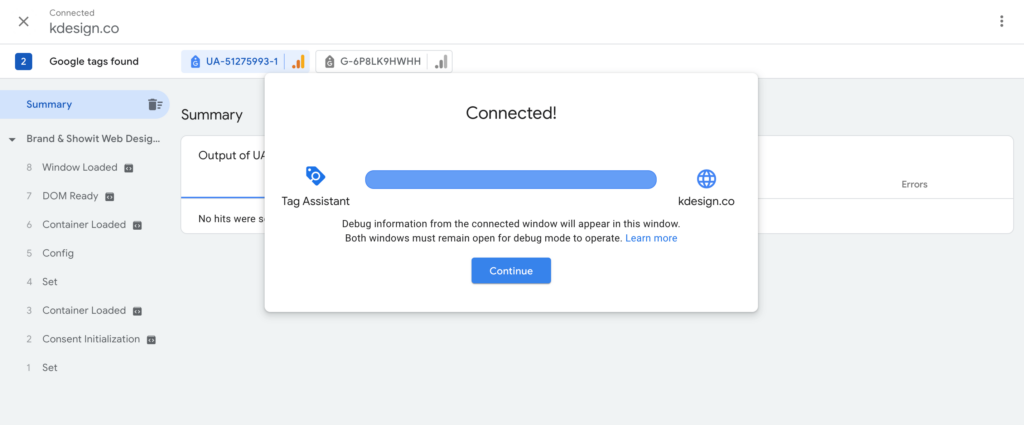
- Then you should see a new window pop-up which will act as your browsing window. Keep your Tag Assistant window open side-by-side, and then you can use it to preview all of the applicable events you take in the browsing window. Explore your site to see how the tag assistant records page views, scrolls, video views, etc.
Related Post: 5 Critical Elements to Convert Visitors on Your Sales Page
How to view your session conversion rates in Google Analytics
Now that you have your custom events set up, you can finally view your website conversion rates. While it’s true you can head over to your Reports > Conversion tab, this information doesn’t actually give you a true conversion rate. It only tells you how many conversions you’ve had, not a percentage of those who converted.
The following steps will help you see how many conversions you’ve had per website session (your session conversion rate), which is more helpful information. Keep in mind this is based on all website traffic, not based on a certain page.
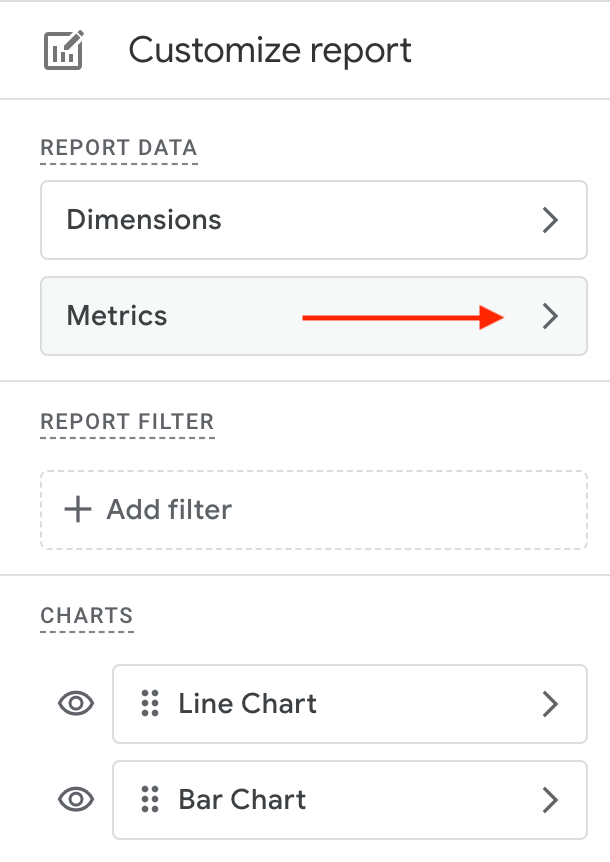
- Go to Reports > Acquisition > Traffic Acquisition
- Click on the pencil icon to edit your traffic report.

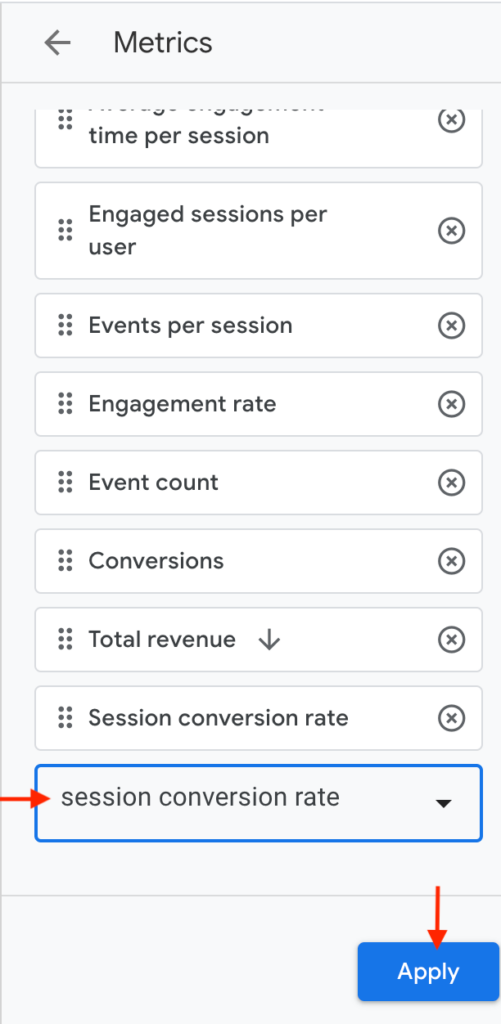
- Select Metrics and then scroll all the way down the list to add a new metric. Type Session Conversion Rate. Then Apply to your report and save.
Now you can view your session conversion rate if you scroll all the way to the right of your Acquisition rerport table. You can then select which conversion event you want to view or select All events to view them all.
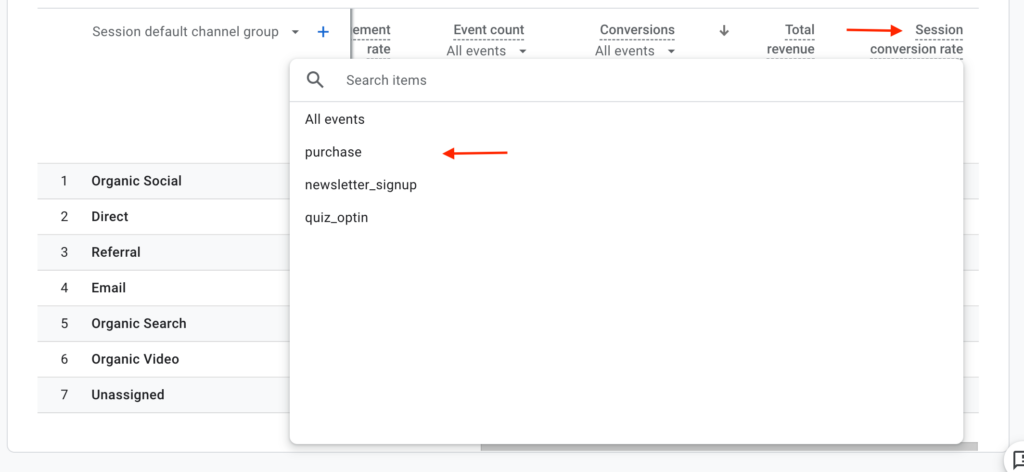
If you are an e-commerce website and want to view a more granular breakdown of your conversion rate by page or product, you can set up a custom funnel report in Google Analytics under the Explore tab.
How to improve your website conversion rate
By keeping an eye on your conversion rates and making little improvements, you can make your website work even better, which ultimately will mean more clients and customers.
If you feel like your conversion rates just aren’t up to par, here are some things you can do to improve your conversion rates.
- A/B Testing: Experiment with different elements (CTAs, forms, page layouts) and measure their impact on conversion rates.
- Improve User Experience: Streamline the user journey, reduce form friction, and provide social proof to boost trust.
- Enhance Page Relevance: Ensure that landing page content matches visitor expectations. Optimize headlines and meta descriptions.
- Improve Page Load Speed: Faster-loading pages can reduce bounce rates. Use Google’s PageSpeed Insights to identify speed issues.
- Clear Call-to-Action (CTA): Make sure every page has a clear, compelling CTA to encourage further exploration.
- Conduct a Website Audit: Do a thorough review of your site, or work with a professional web designer to identify areas for improvement in the design.
Related Post: 7 Website Usability Mistakes You’re Making (And How to Fix Them)
In the world of online business, data should be your compass. While Google Analytics can be a little tricky to navigate at first, spending some time to dig deeper into your analytics is time well spent because you’ll gain the insight to make informed decisions for your business.
Need help improving your website conversion rates with a website redesign? Reach out to K Design Co.

